
Information design that drives Malaysian market decisions.
Raw data is a liability until it is structured. Canton Market View transforms complex datasets into static, high-fidelity visualization assets designed for executive review and strategic planning.
Standardized Delivery Formats
We avoid the noise of interactive dashboards that often obscure simple truths. Our visualization services focus on "Golden Standard" static reports that are ready for boardrooms, investor pitches, and internal policy documents.
Precision Guarantee
All charts are cross-verified against three independent local data sources.
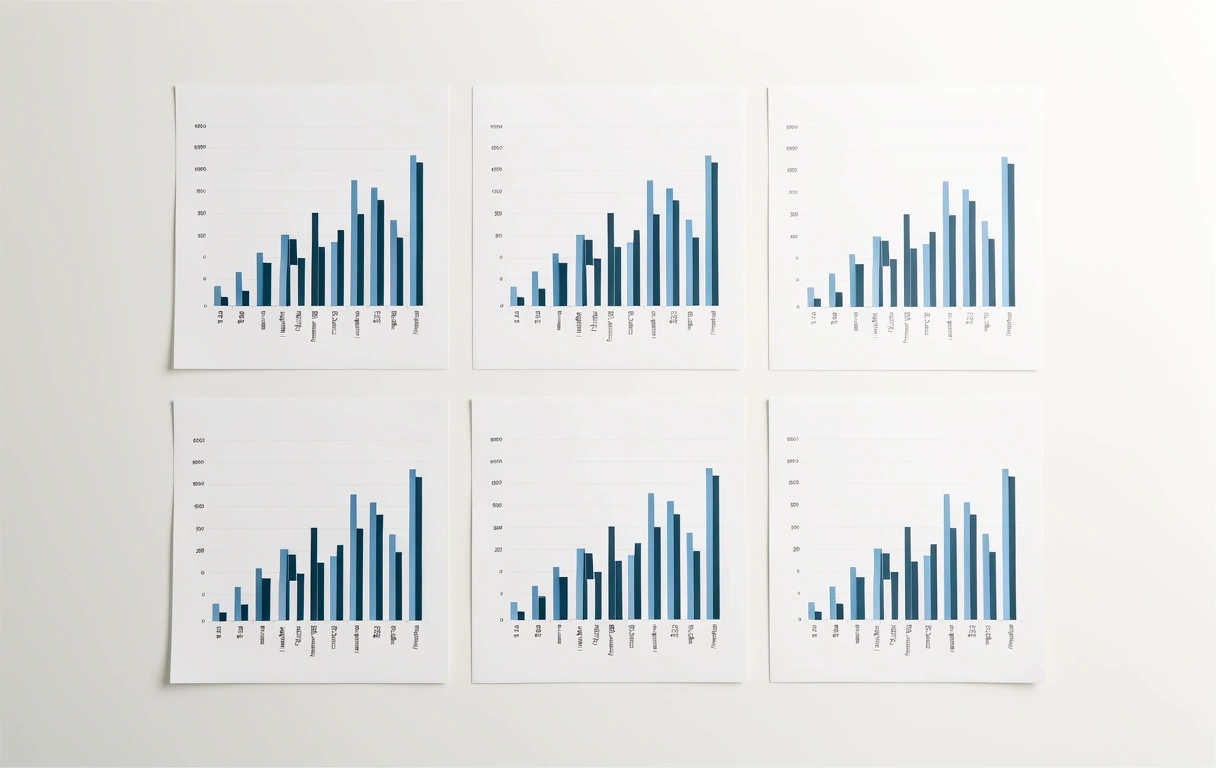
Trend Analysis Charting
Multi-variable time-series plots that identify seasonal cycles within the Malaysian retail and industrial sectors. We specialize in isolating signal from noise.
- Moving Averages & Smoothing
- Year-on-Year Growth Markers
- Cyclical Peak Identification
Competitive Maps
Geospatial market analytics showing saturation levels across Peninsular and East Malaysia. Essential for logistics planning and site selection.
- Heatmapping of Competitor Density
- Infrastructure Proximity Analysis
- Demand Variance by State
Structured Dossiers
Comprehensive PDF volumes that combine visualization with high-density technical copy, explaining the "why" behind every data point found.
- Executive Summary Overlays
- Statistical Significance Annotations
- Print-Ready High Resolution
Strategic Data Design
Custom visual flows for niche industries. We translate supply chain complexities into intuitive diagrams that highlight bottlenecks.
- Sankey & Flow Diagrams
- Hierarchical Dependency Charts
- Multi-Stakeholder Views
Visual Quality Standard
Every asset delivered by Canton Market View follows a strict design protocol to ensure mathematical accuracy and visual hierarchy.

High-Fidelity Rendering
Our charts utilize a custom color palette designed for maximum legibility in both digital presentations and physical printouts.
No-Clutter Methodology
We strip away non-essential grid lines and decorative elements. The result is a visualization that communicates the core market insight in under three seconds.
Contextual Baseline
We don't just show numbers; we show them against industry benchmarks. Every chart includes localized Malaysia-wide data averages for immediate comparison.
Color-Coded Logic
Our visual system uses a consistent color vernacular. Risk is always isolated, growth is always emphasized, and stability is grounded in neutral tones.
The Visualization Lifecycle
Our process ensures that the final output is not just pretty, but technically sound and aligned with your business objectives. From raw ingestion to final export, we handle the heavy lifting.
- Data Cleaning & Vector Normalization
- Pattern Detection & Insight Extraction
- Layout Engineering & Visual Hierarchy

Service Particulars
Better insight starts with better sight.
Discuss your reporting needs with our analysts in Kuala Lumpur and see how structured market analytics can change your outlook.
Mon-Fri: 9:00-18:00 | +60 3 1000 0001